The Arpanet is the electronic network that became what we know now as the Internet. The earliest and most widespread representation of this early network were graphs or maps that, arguably, remain its most prominent visual artifact. In three articles co-authored by myself and Bradley Fidler, we analyze 20 years of these maps, asking how they were created, what they represented, and how histories of the network parallel their emphases and omissions. We analyze the maps to highlight what is missing from them, including directions and rates of communication flows, gateways to other young networks in the US and the UK at the same time, and hierarchies of power between nodes.

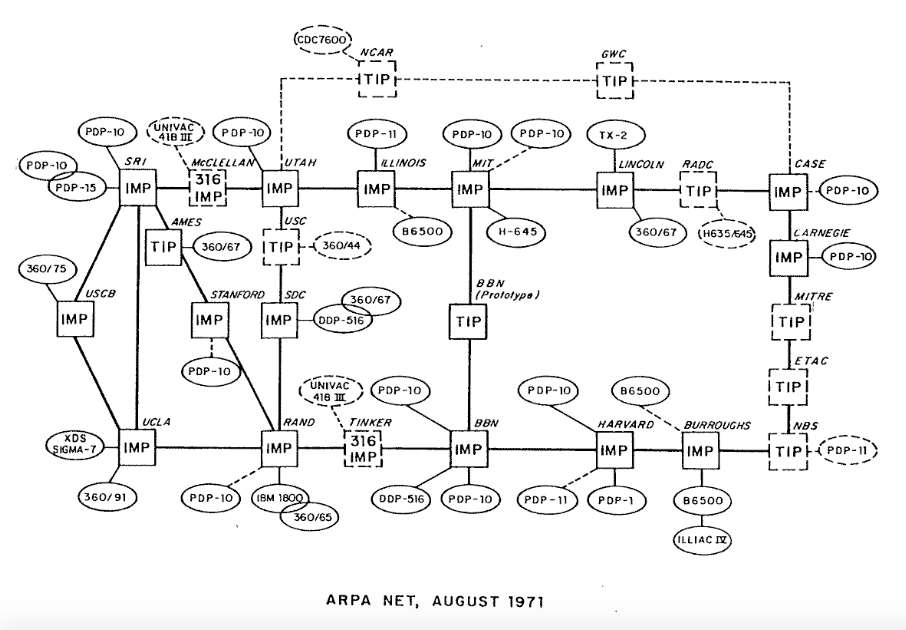
[Geographic and Logical Maps of the Arpanet, 1980 and 1971]
In our analysis, we draw from scholars of digital humanities and feminist geography. We discuss how graphic representations such as maps are composed of what Digital humanist Johanna Drucker calls “capta,” or organized and parameterized constructions in graphical expression (Drucker avoids using the term “data,” shrouded as it is in the common misperception that data are equivalent to phenomena in the world). That is, graphic visualizations are always based on the selection of measurement criterion, data, and visual metaphors – on actions that involve interpretation. We therefore set out to examine maps not as passive records capturing a priori data about the world, but as constructions reflecting the choices of their designers and the conventions of their time.
Feminist geographer Sara McLafferty likewise argues that geographic maps present a detached, god’s-eye-view, representing the efforts of individuals or groups as dots and complex activity patterns as linear pathways. The design of a map cannot capture the variegated spatial experience of everyday network activity. The ARPANET maps deploy a distributed, topological network graph form, an analytic design deriving in part from 18th and 19th graph theory developed in the fields of mathematics, electricity and chemistry. The design is one that likewise privileges a geometric, spatial perspective over relational or causal dimensions, often hiding the complex agencies and directional flows involved in technological projects. Digital humanist Phillip Gochenour also points out the potential of network graph models to reify political and economic structures in a way that makes conflict, difference or malfunction invisible: only connection and smooth technical or social functioning can be represented in the graph; any broken or odd parts are often left out.
Bibliography
Drucker, Johanna. (2016). “Humanities Approaches to Graphical Display.” 5.1 (2011): n. pag. Digital Humanities Quarterly. Web. 25 Oct.
Fidler, B., and Currie, M. (2016). “Infrastructure, Representation, and Historiography in Bolt Beranek and Newman’s Arpanet Maps.” IEEE Annals of the History of Computing 38, no. 3 (July 2016): 44–57. doi:10.1109/MAHC.2015.69.
Fidler, B., and Currie, C. (2015). “The Production and Interpretation of Arpanet Maps,” IEEE Annals of the History of Computing, 37(1), 44-55.
Fidler, B., and Currie, M. (2015). “Gateways: Historical Underpinnings of a Single Internet,” iConference 2015 Proceedings.
Gochenour, Philip. (2011). “Nodalism,” Digital Humanities Quarterly 5.3.
McLafferty, Sarah. “Women and GIS: Geospatial Technologies and Feminist Geographies”, Cartographica, volume 40, Issue 4: 37-45.
Credits
Morgan Currie and Bradley Fidler, with support from the Kleinrock Center for Internet Studies.